Mission Statement
The Fire Alarm: Science Data Platform for Wildfire and Air Quality aims to provide the scientific foundation for the development of air quality data applications and decision support tools for scientists, policymakers, resource managers, and the public. The program aims to improve the understanding of atmospheric composition, air quality, and their interactions with climate and ecosystems, and to develop innovative solutions to air quality challenges. The program was established through the support from the NASA AIST Fire Alarm and Air Quality Analytics Collaborative Framework (AQ ACF) investments, which aims to better understand Earth's systems and changes to inform decisions that affect the future of the planet.
An Integrated Platform for Air Quality
In-situ analysis
Satellite observations
Numerical modeling
Air Quality Prediction
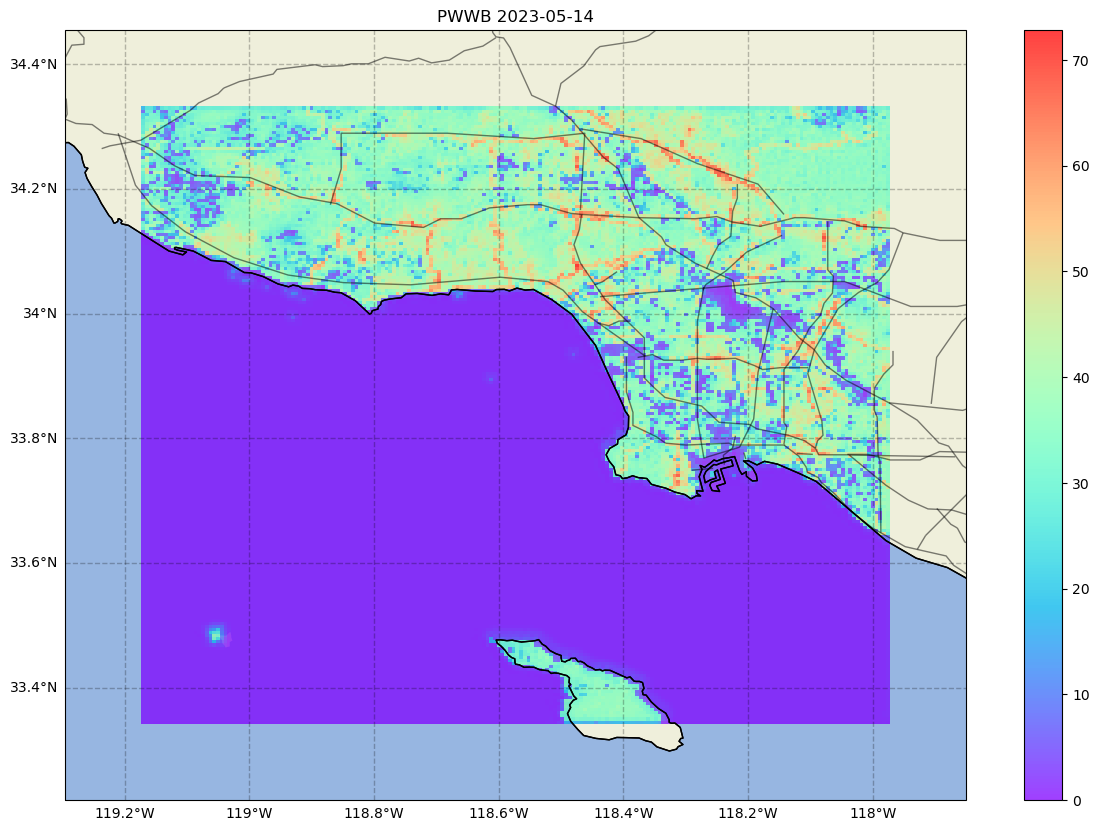
Machine learning is revolutionizing the way we approach air quality management. At NASA-JPL we are using advanced algorithms to predict air quality with unprecedented accuracy, helping individuals and communities make informed decisions about their health. Below is a plot generated from Predicting What We Breathe data in the LA region.
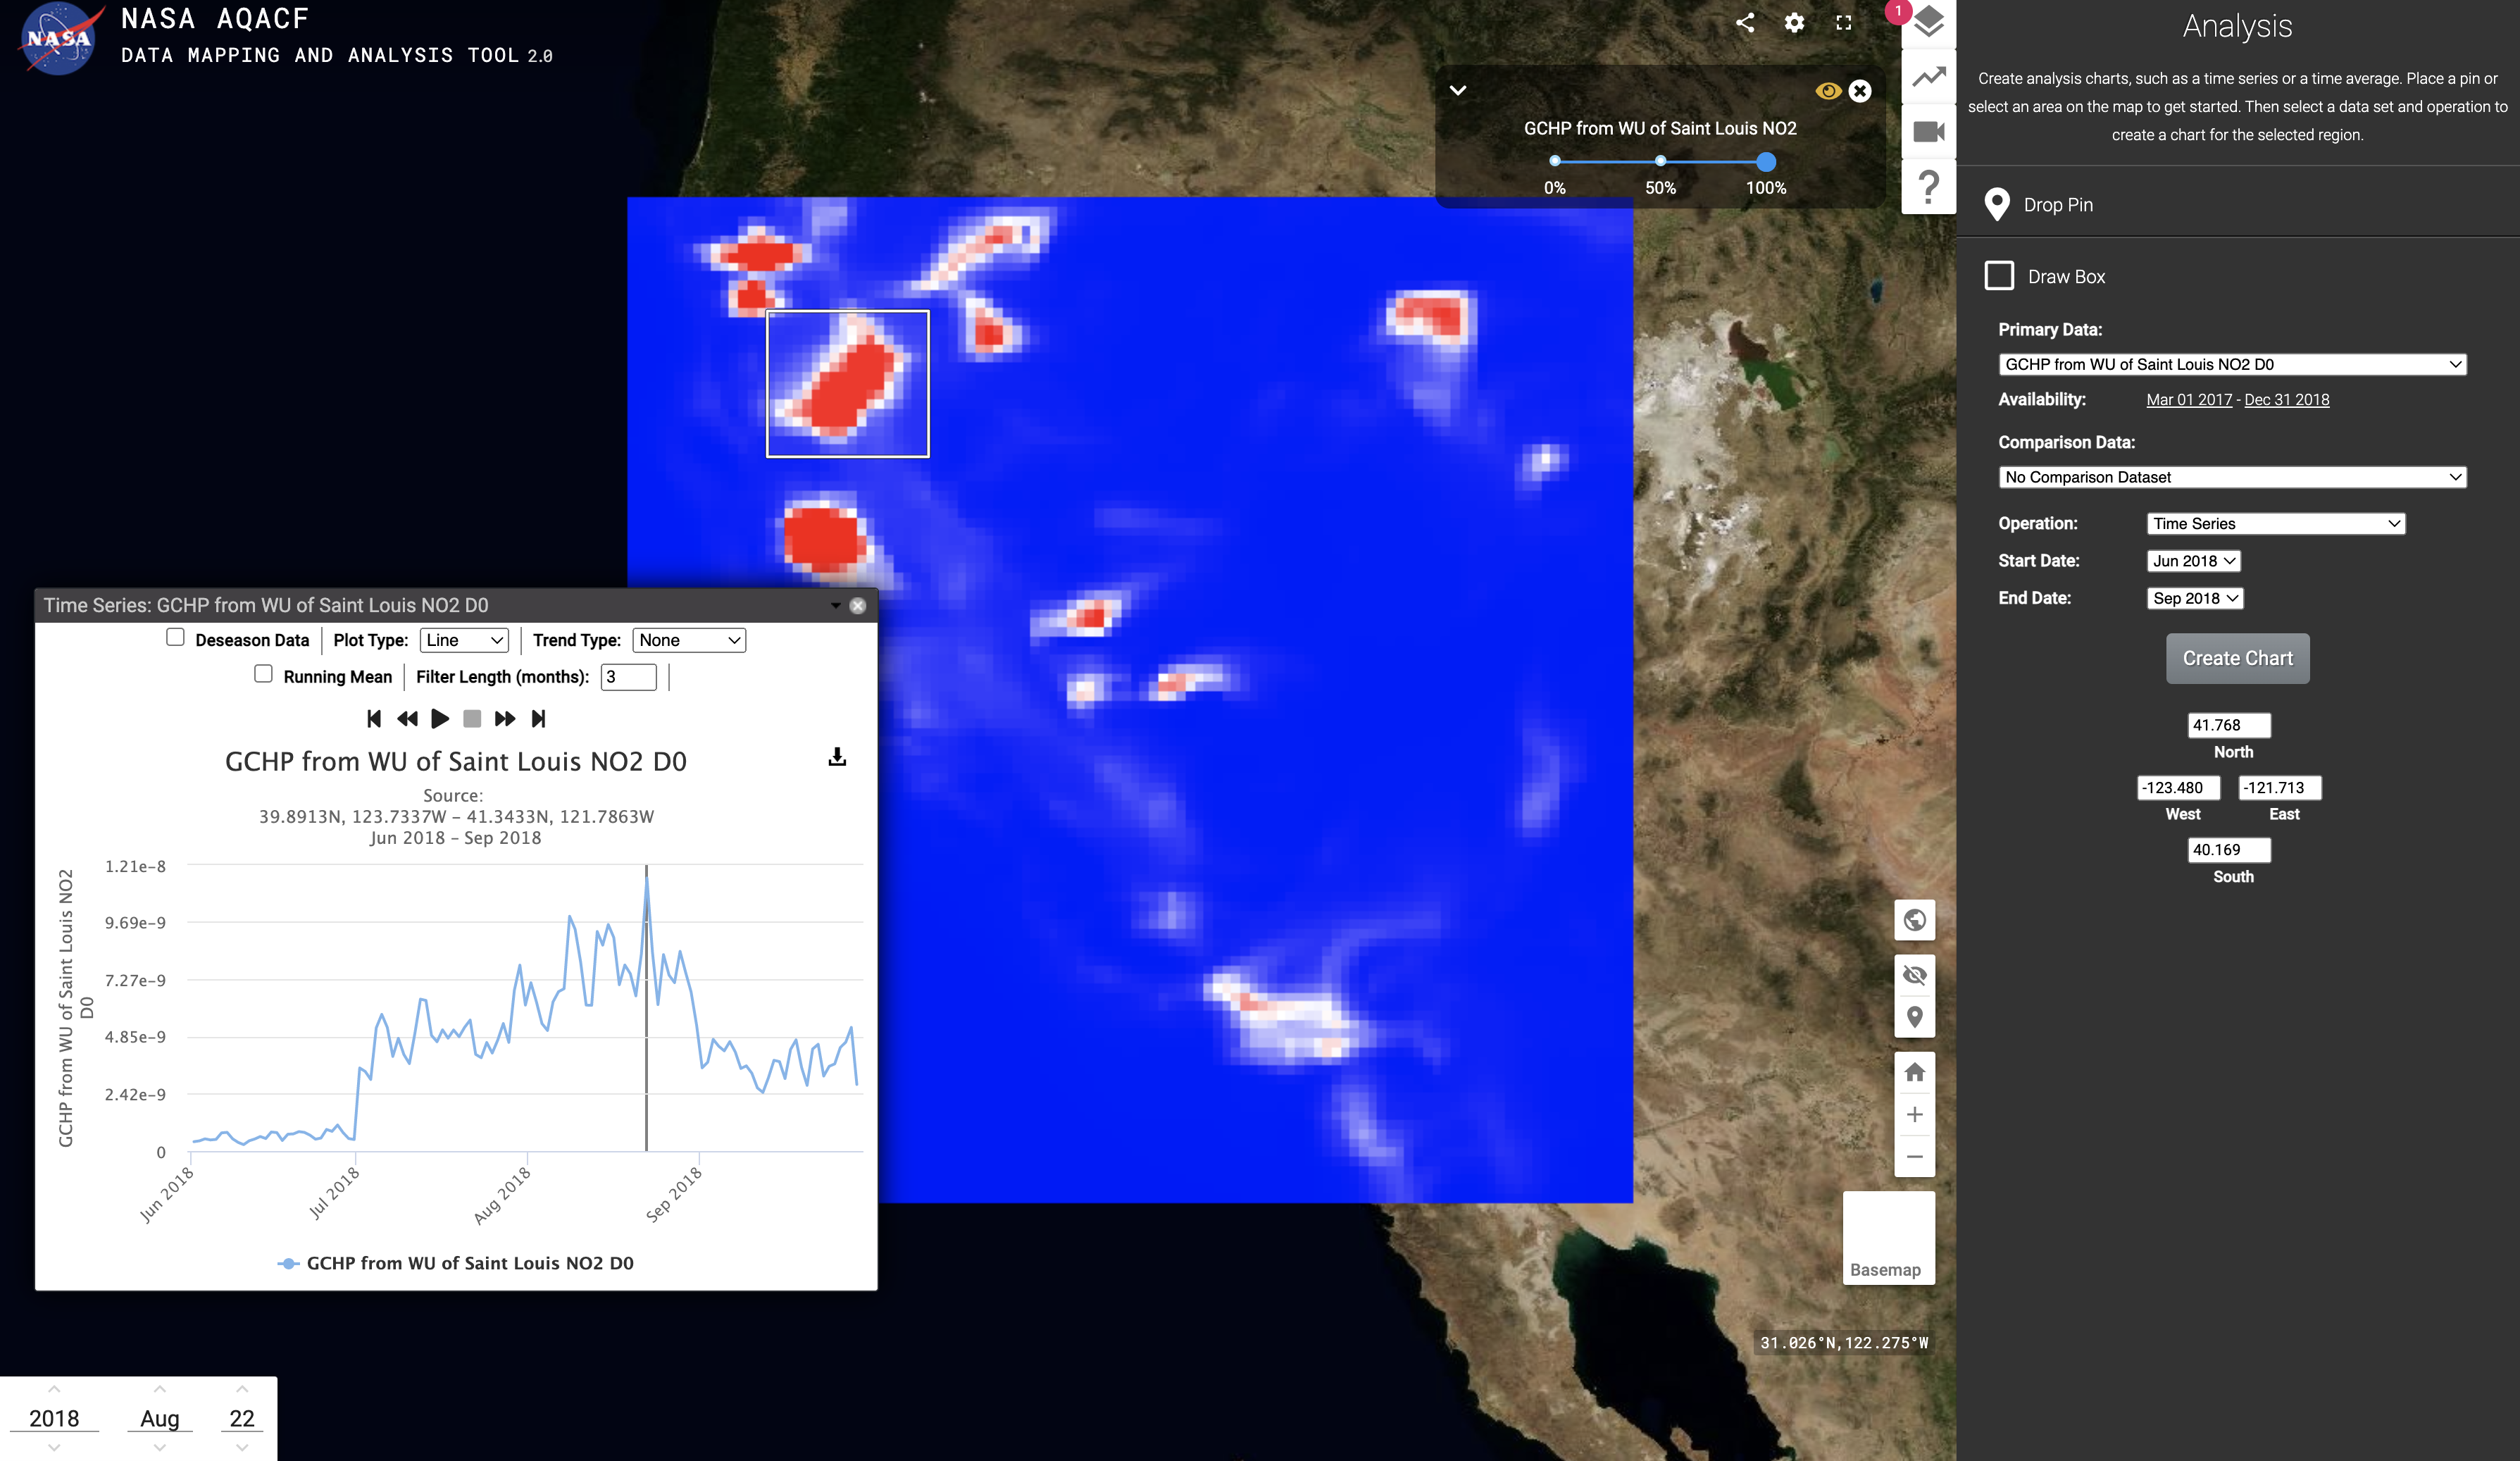
Data Mapping Tool
The Air Quality Data Mapping Tool is a web-based platform that provides access to NASA-JPL satellite data products related to air quality, including aerosol optical depth, nitrogen dioxide, and sulfur dioxide. The tool allows users to view and download data, as well as create custom visualizations and maps for analysis and research. It also provides access to data from ground-based monitoring networks and other sources, allowing for comprehensive analysis of air quality across regions and over time.
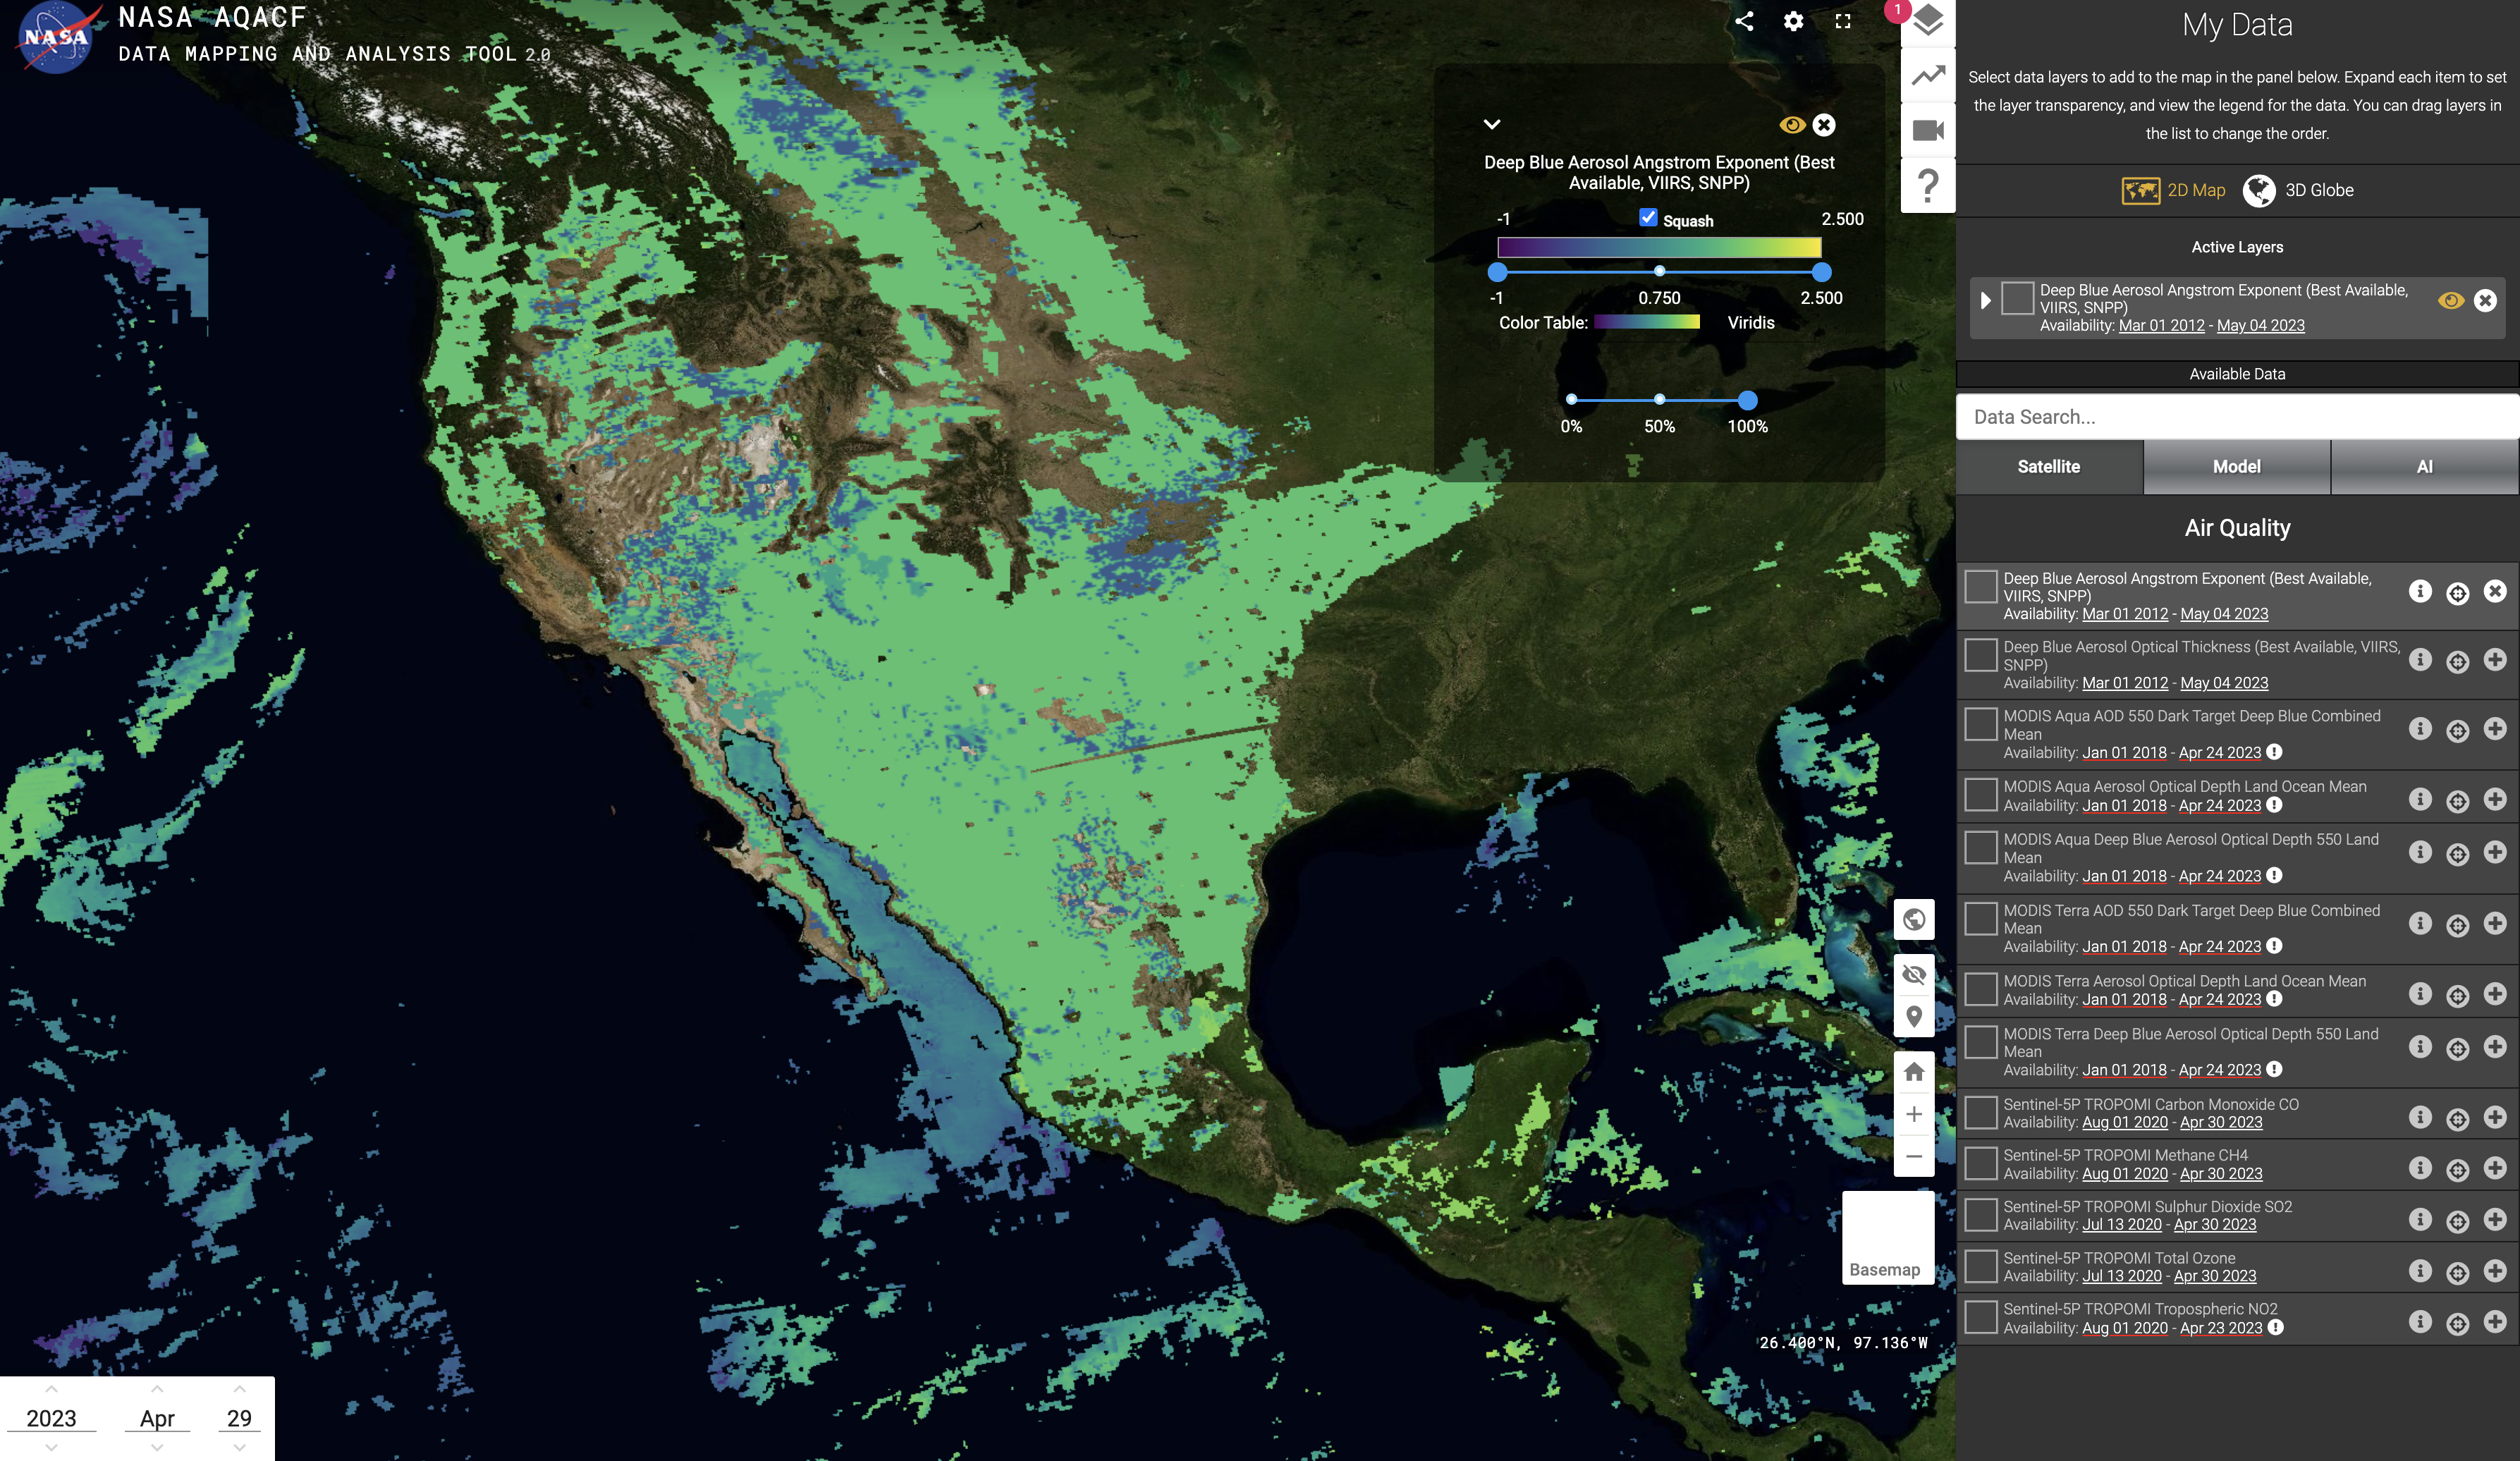
Unlocking the Potential of Big Data Analytics
Explore and analyze large data sets from various sources, including satellite observations, atmospheric models, and IoT sensors. The Air Quality data mapping tool's intuitive interface and visualization capabilities make it easy to gain insights and make informed decisions based on complex data.
Launch the Tool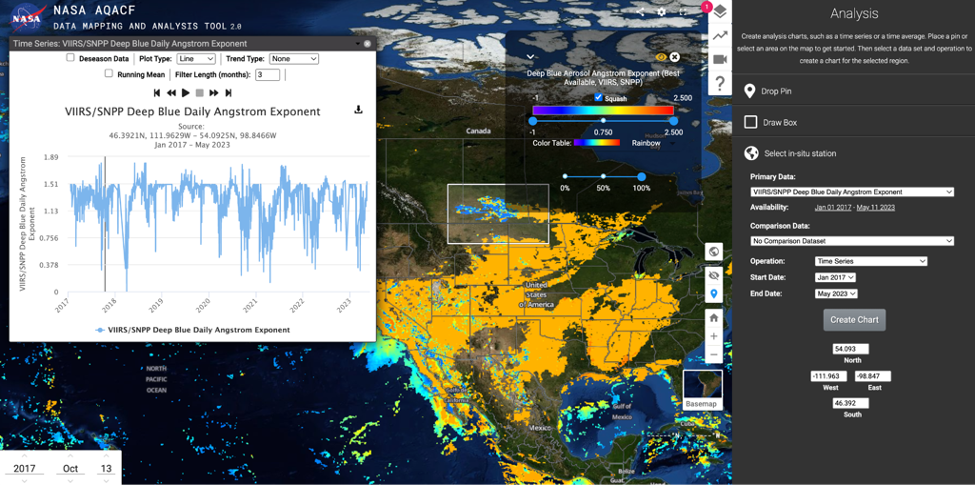
Immersive Science
VR technology has significantly impacted our understanding and approach to scientific exploration. The immersive and interactive capabilities of VR allow us to step into simulations and experience scientific concepts in unprecedented ways. See for yourself how we are utilizing the latest advancements in VR technology to shape the future of scientific research. Click the button below to watch our video and learn more.
Watch PreviewAnalyze Data Quickly and Efficiently
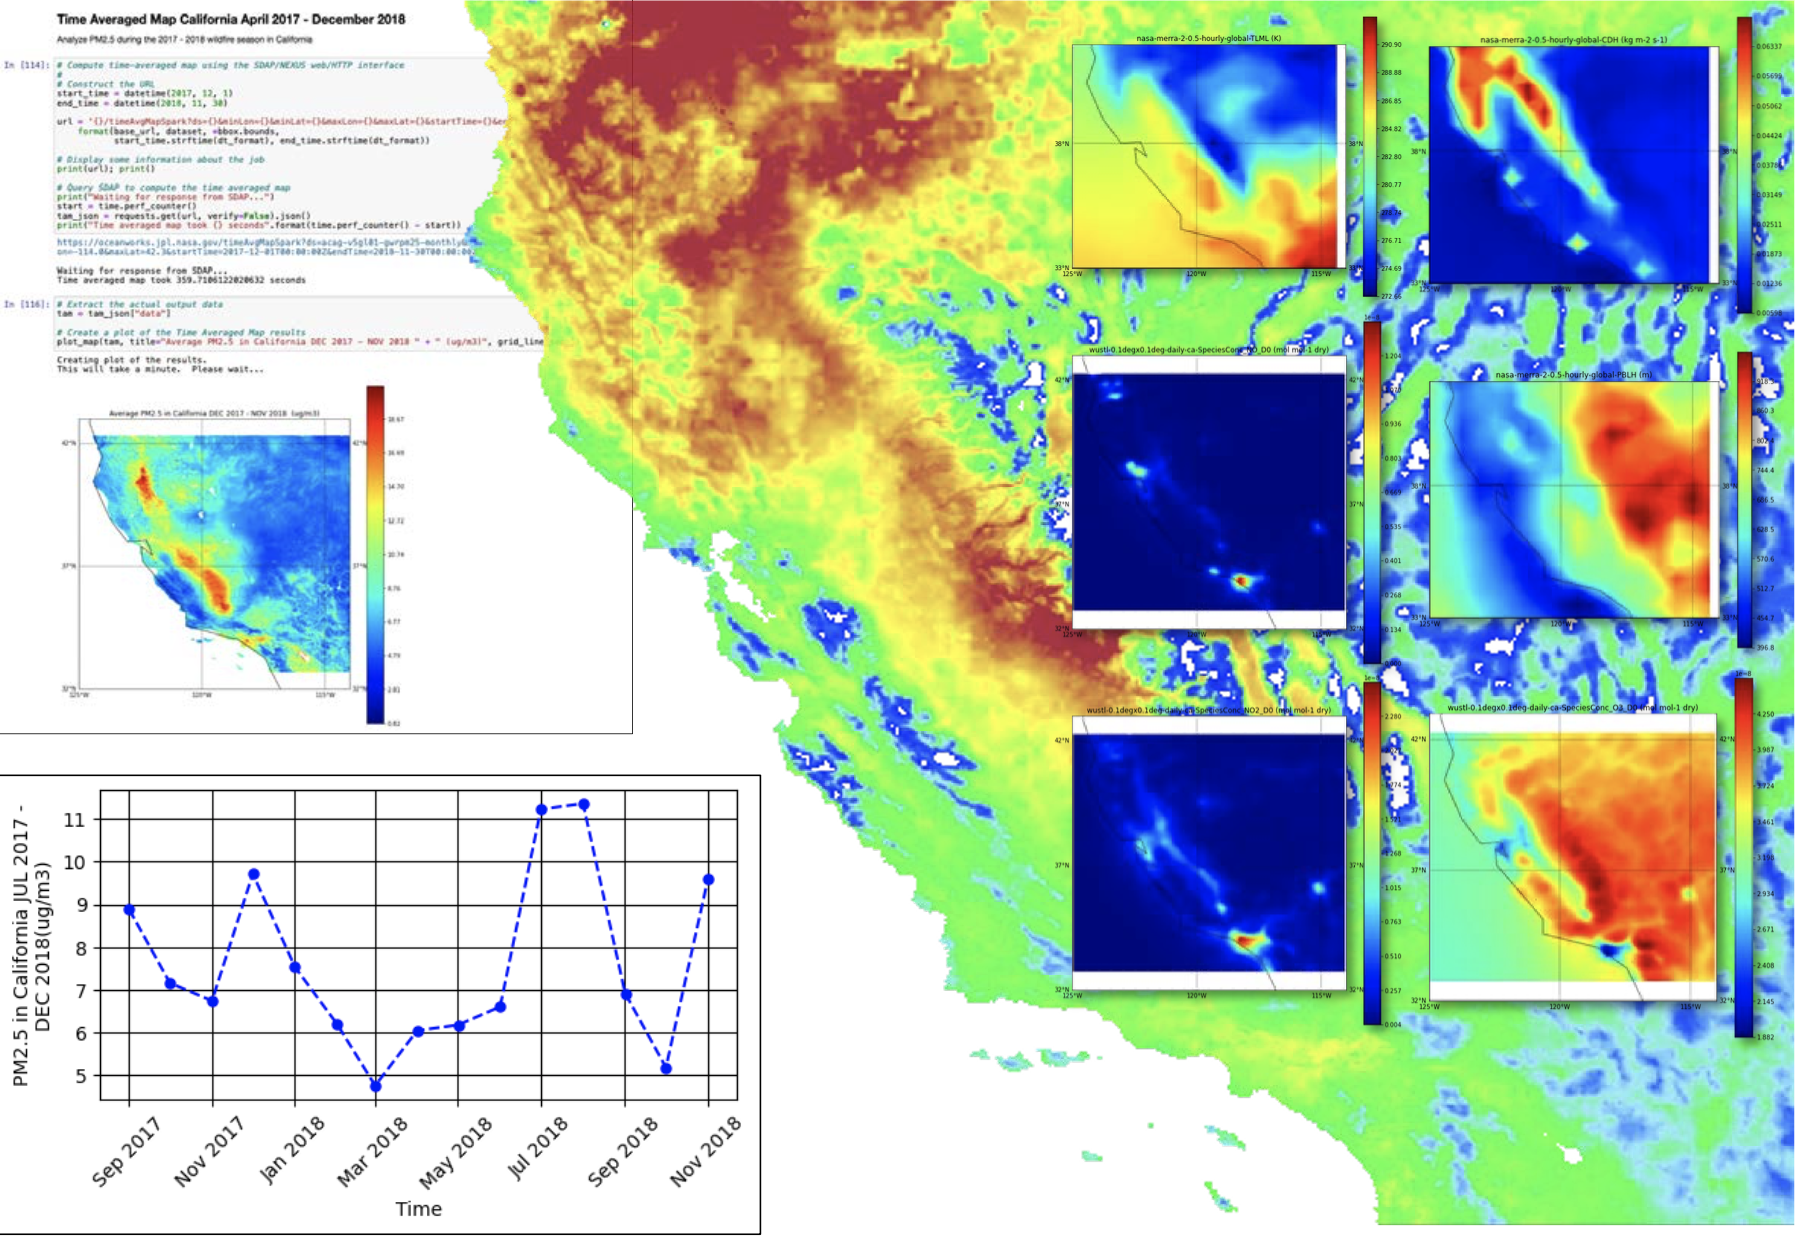
Fire Alarm: Science Data Platform for Wildfire and Air Quality Open-Source API Demonstration
NASA-JPL is committed to making science open and accessible to everyone which is why we make and support open-source projects. Our open-source Jupyter notebook is designed to showcase the versatility and simplicity of the platorm. With our open-source software you are able to easily generate high quality graphs with little to no experience writing code. This interactive notebook provides a hands-on experience, demonstrating various use cases where open-source software excels in graph generation. With step-by-step code examples, even those new to data visualization can quickly grasp the process and produce visually stunning graphs.
Featured Use Cases
Here are three featured use cases that illustrate the power of the Science Data Platform for Wildfire and Air Quality.
1. 2021 California Wildfire Season
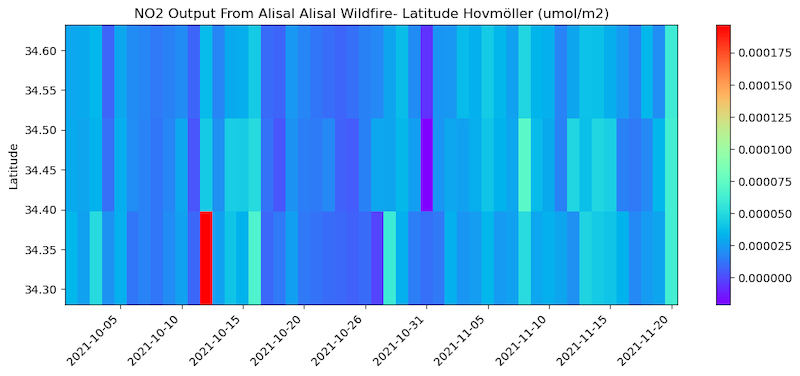
NO2 levels during the 2021 California wildfire season provide important insights into the spread and impact of the fires. Increases in NO2 concentrations were observed over the areas affected by the wildfires, indicating the presence of combustion-related pollutants in the atmosphere. These observations help to inform public health and safety measures during wildfires, as well as aid in the development of more accurate fire models and predictions for future wildfire seasons.

NO2 latitude Hovmöller

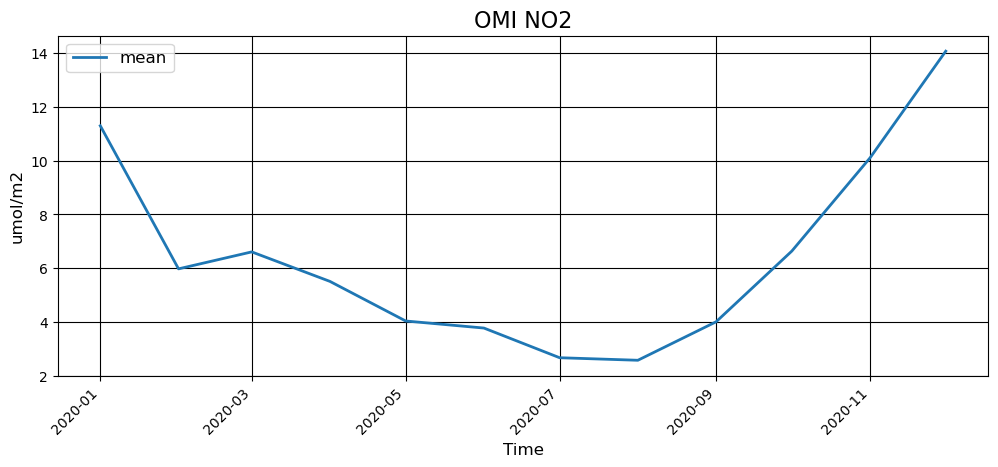
NO2 temporal mean

TROPOMI NO2 total tropospheric column
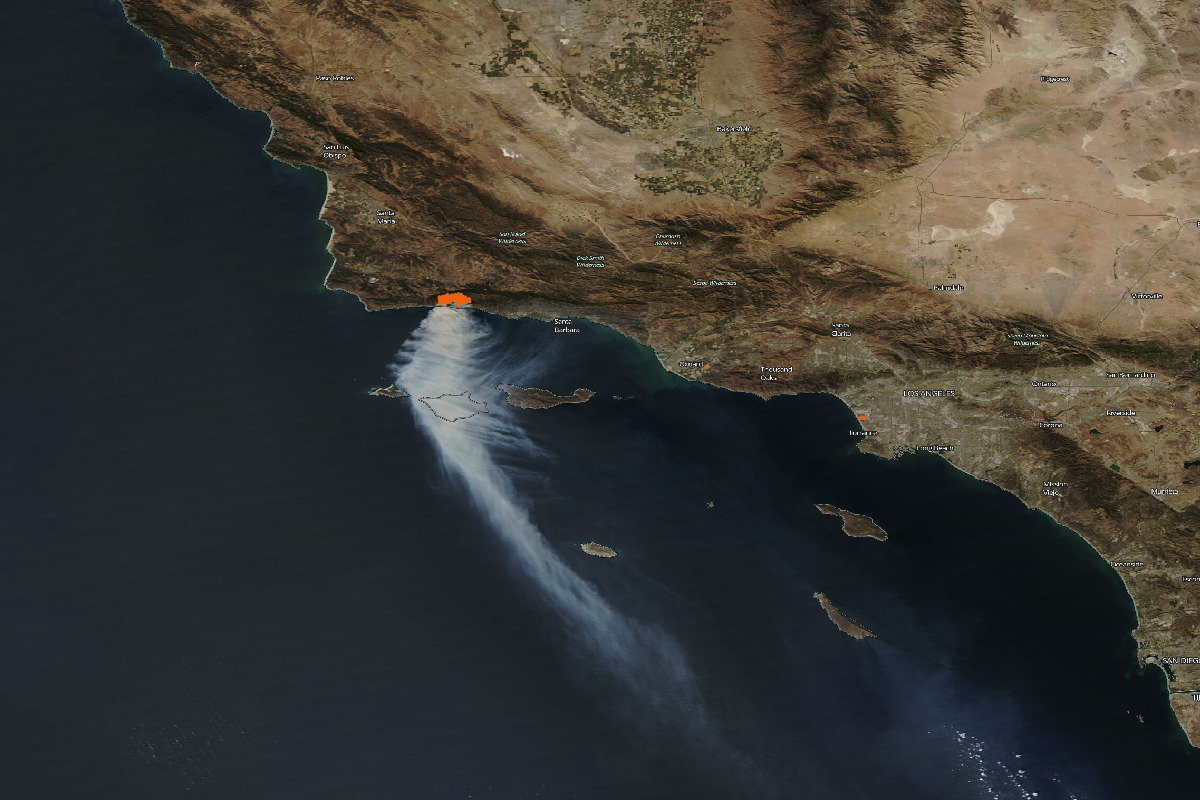
2. Dixie Wildfire
The Dixie wildfire began in the Feather River Canyon near Cresta Dam on July 13, 2021, and burned 963,309 acres before being 100% contained on October 25, 2021.It was the largest single (i.e. non-complex) wildfire in recorded California history, and the second-largest wildfire overall.
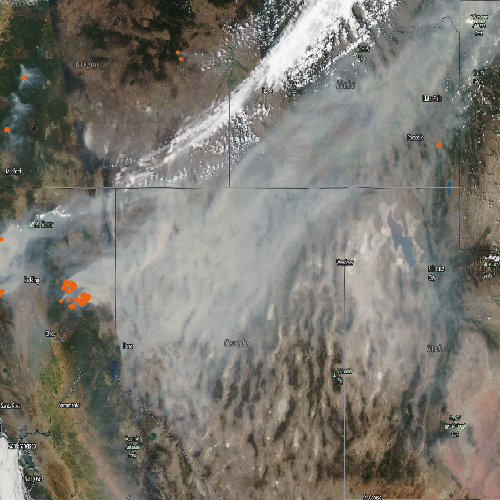
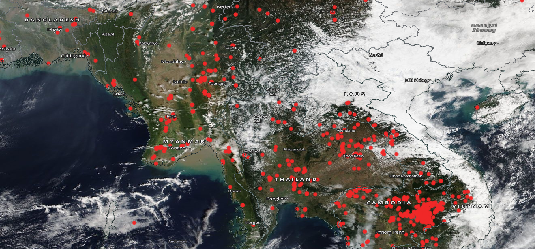
MODIS satellite imagery

Carbon Monoxide (CO) Temporal Mean

Aerosol Index data from the Ozone Mapping and Profiler Suite (OMPS)
instrument
aboard the Suomi National Polar-orbiting Partnership (NPP) satellite
3. Los Angeles Port Backlog (Fall 2021)
Beginning around October 2021, the Ports of Los Angeles and Long Beach started suffering serious backlogs of ships due a surge in e-commerence because of the COVID-19 pandemic. This resulted in many ships anchored in the ports which caused high amounts of pollutants to be released.

VIIRS Aerosol Optical Thickness
average daily difference from climatology
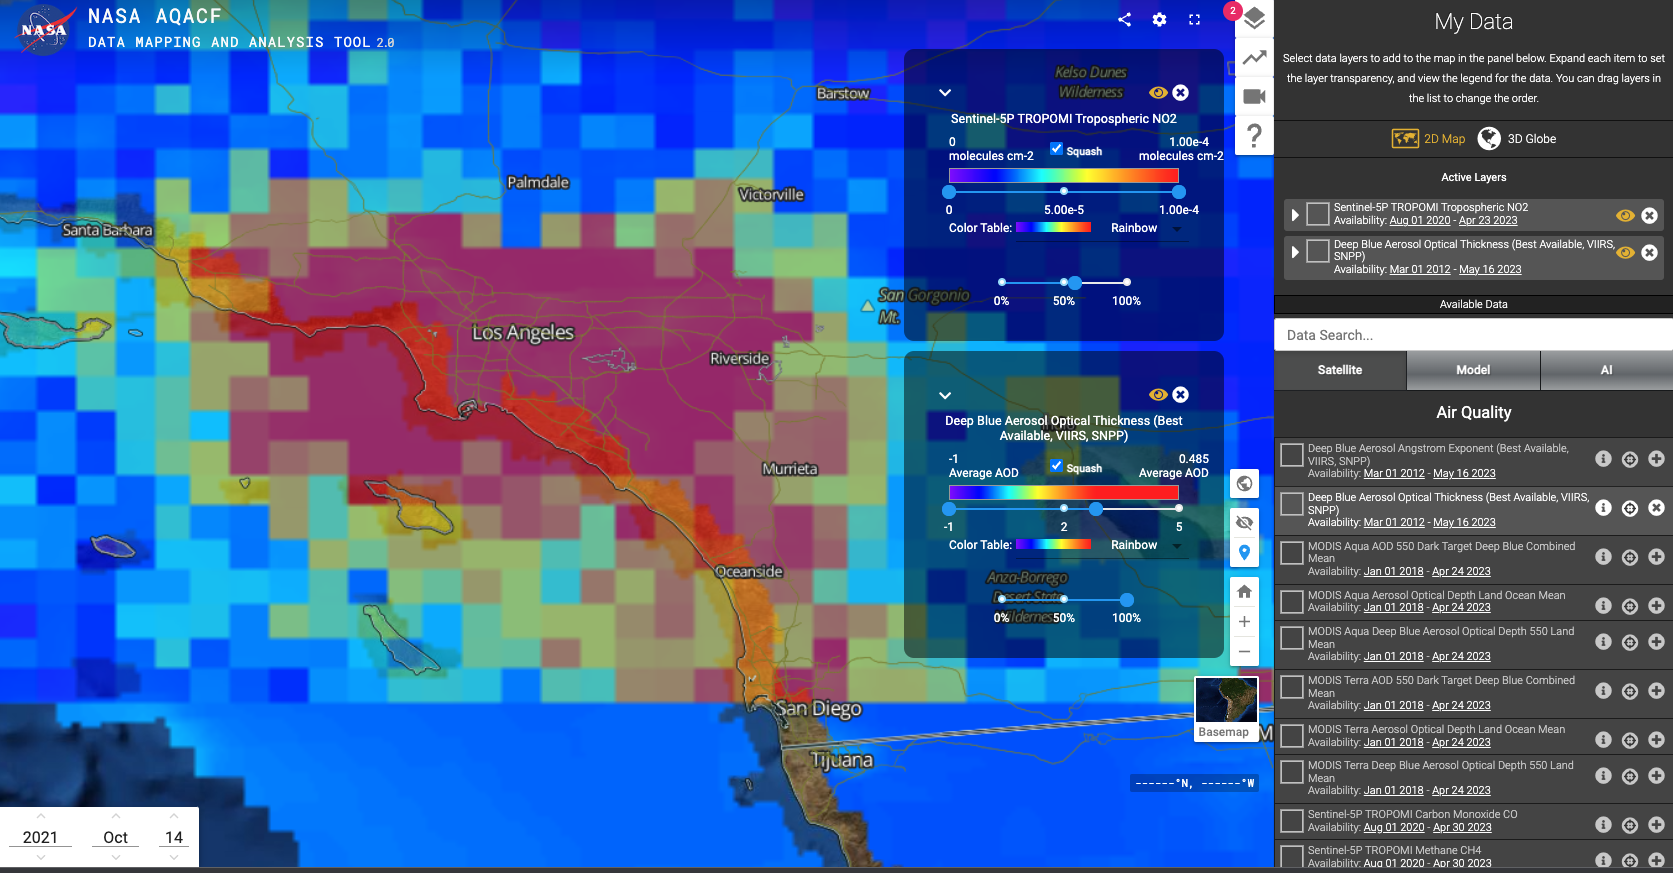
VIIRS Aerosol Optical Thickness and TROPOMI NO2
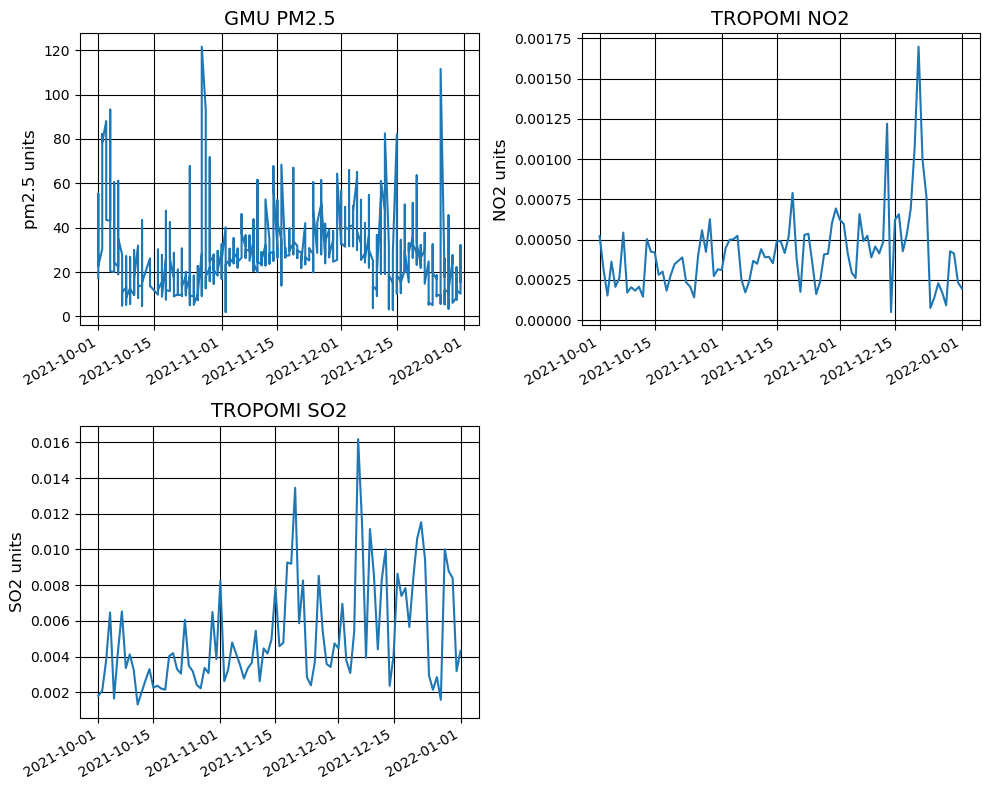
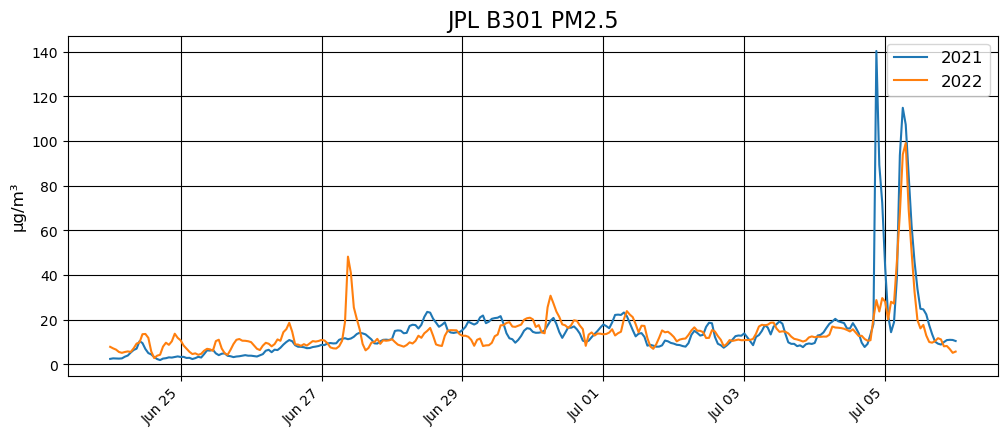
PM2.5, NO2, and SO2 timeseries

TROPOMI NO2 total tropospheric column
4. California 2035 Electric Vehicle Mandate (Scenario-based Prediction)
The state of California plans to ban the sale of new gasoline-powered cars by 2035. This mandate requires 35% of new vehicles sold in CA to be electric by 2026. This will then increase to 68% in 2030 and 100% in 2035. These actions are estimated to achieve a more than 35% reduction in greenhouse gas emissions and an 80% improvement in NOx emissions from cars.

Key for health impact graphs

Pollution reduction health impacts in Los Angeles.

Pollution reduction health impacts in New York.

Pollution reduction health impacts in Chicago.