IDEAS for Flood Analysis
Through satellite data acquisition and space technologies, the Integrated Digital Exploratory Analysis System (IDEAS) aims to develop alert systems and flood risk maps on local and global scales. Built for scenario based analysis, IDEAS for Flood Analysis provides on-demand data and analysis acquisition and uses the latest observation and analysis to drive model predictions to provide decision support for flood risk mitigation and future instrument scheduling and tasking.

| Satellite Observations | In-situ Analysis | Numerical Model Outputs |
|---|---|---|
Hurricane Ian Precipitation Rate
|
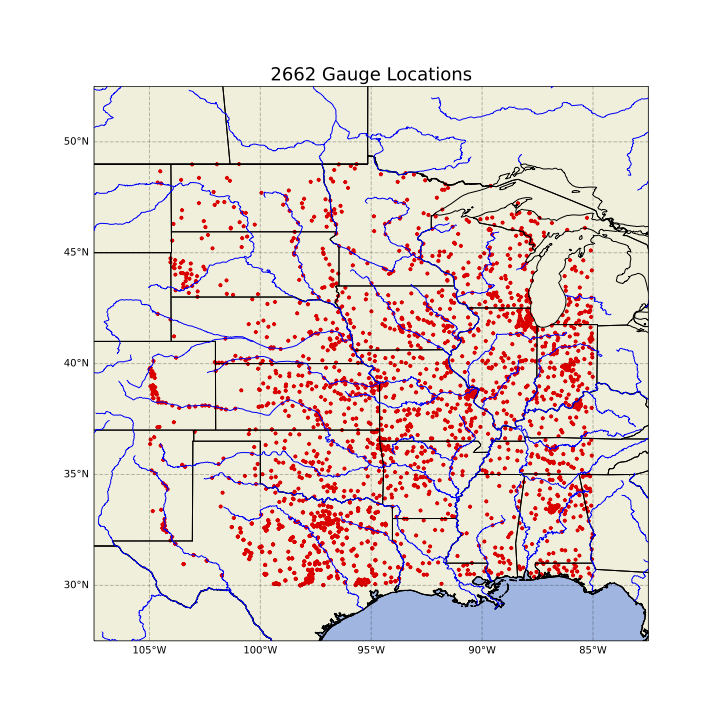
USGS Mississippi Use Case Gauge Locations |
Garrone River Flood |
Land Surface Model
Land Information System (LIS)
LIS is a land surface hydrology digital twin enviornment used for high performance terrestrial hydrology modeling and data assimilation. The development of LIS is led by the Hydrological Sciences Laboratory at NASA's Goddard Space Flight Center, with the goal of integrating satellite and ground-based observational data products with advanced modeling techniques to produce optimal fields of land surface states and fluxes.
The LIS framework facilitates the creation, composition, and modification of personalized land data assimilation setups. This is achieved effortlessly through the utilization of communal add-ons and established interfaces. Additionally, the platform permits the incorporation of a range of land surface models, such as Noah, Noah-MP, CLM, and VIC, among alternative options. LIS delivers a transportable, expandable, and adaptable framework, supporting the evaluation and integration of cutting-edge Earth science investigations into operational use alongside collaborative agency associates.
Visit LIS Framework Homepage
River Routing and Discharge Model
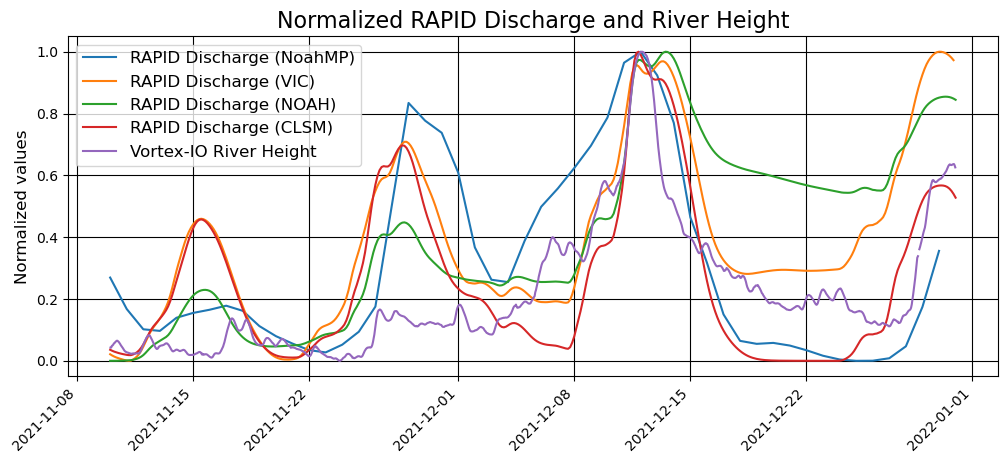
Routing Application for Parallel computatIon of Discharge (RAPID)
RAPID is an open-source river routing model. Given surface and groundwater inflow to rivers, this model can compute the flow and volume of water everywhere in river networks made out of many thousands of reaches. The design of RAPID allows it to be adapted to any river network, if given basic connectivity information. RAPID uses a matrix version of the Muskingum method, and has an automated parameter estimation procedure that allows finding optimal model parameters based on available gage measurements. RAPID has the ability to run and/or optimize model parameters on any subbasin included in its computing domain. If major man-made infrastructures are present on the river network, RAPID allows to easily substitute upstream flow measured by gages within its simulations of river flow and its optimization of parameters. If information concerning water withdrawals or return flows is available, RAPID can remove or add the corresponding flows from its computations as well. Visit the RAPID Homepage to read publications, see more animations, and download the source code.
|
An animation is of the Upper Mississippi Basin, USA, over four months. 3-hourly surface and
subsurface runoff was produced from hourly VIC data downloaded
from NLDAS2, and RAPID was run at a 15-minute time step.
|
An animation of the Texas Gulf Coast Hydrologic Region, USA, over four months. 3-hourly surface and
subsurface runoff was produced by the Noah-MP land surface model using NLDAS2 atmospheric forcing,
and RAPID was run at a 15-minute time step.
|
Water Level Mapping
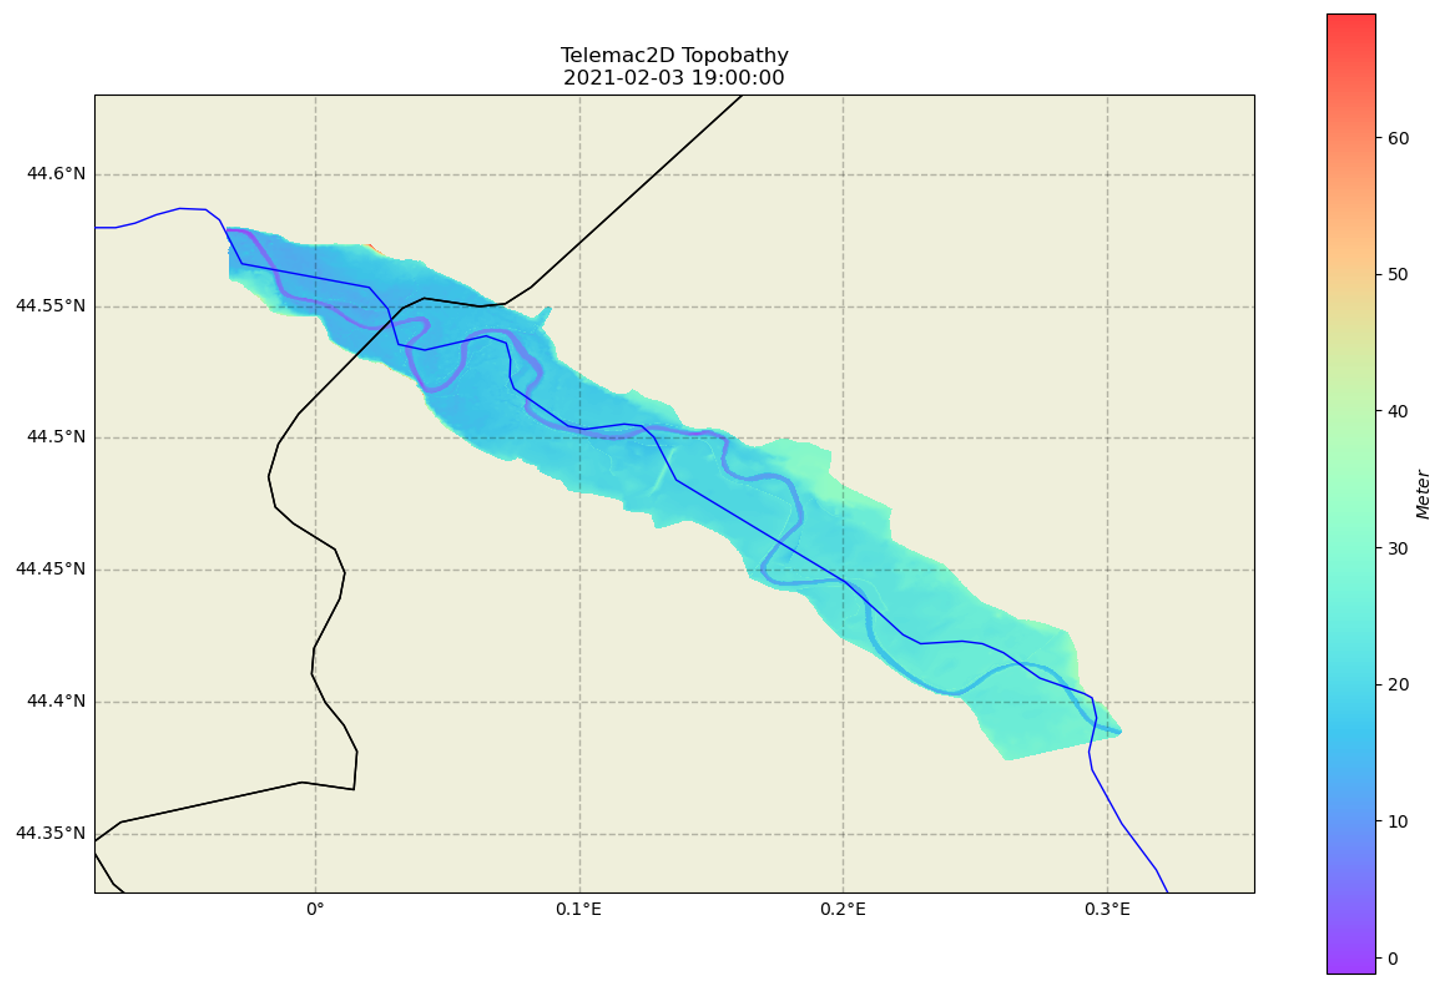
Telemac2D
Telemac2D is a simulation module within the open-source Telemac-MASCARET software suite developed by the Centre Européen de Recherche et de Formation Avancée en Calcul Scientifique (CERFACS) for use in the field of free-surface flow. This suite encompasses both hydraulics and hydrology, providing a comprehensive approach to understanding water behavior. The simulation modules within Telemac-MASCARET use high-capacity algorithms based on the finite-element method, making them versatile tools for studying fluid dynamics in various contexts.
Telemac2D, specifically, focuses on simulating two-dimensional flows and can be used to model water levels via satellite imagery for a wide range of scenarios, from river systems to coastal areas. The model uses the amount of water entering the river system to compute water level and velocity in the river network, and when the storage capacity of the river is exceeded, the flood plain. This assists the prediction of a system's water surface elevation and velocity, from which flood risk can be assessed for lead-times that range from a couple hours to several days.
observations taken between March and December 2021.
Analyse Data Quickly and Efficiently
IDEAS Open-Source API Demonstration
NASA-JPL is committed to making science open and accessible to everyone which is why we make and support open-source projects. Our open-source Jupyter notebook is designed to showcase the versatility and simplicity of the platorm. With our open-source software you are able to easily generate high quality graphs with little to no experience writing code. This interactive notebook provides a hands-on experience, demonstrating various use cases where open-source software excels in graph generation. With step-by-step code examples, even those new to data visualization can quickly grasp the process and produce visually stunning graphs.

|
|
|
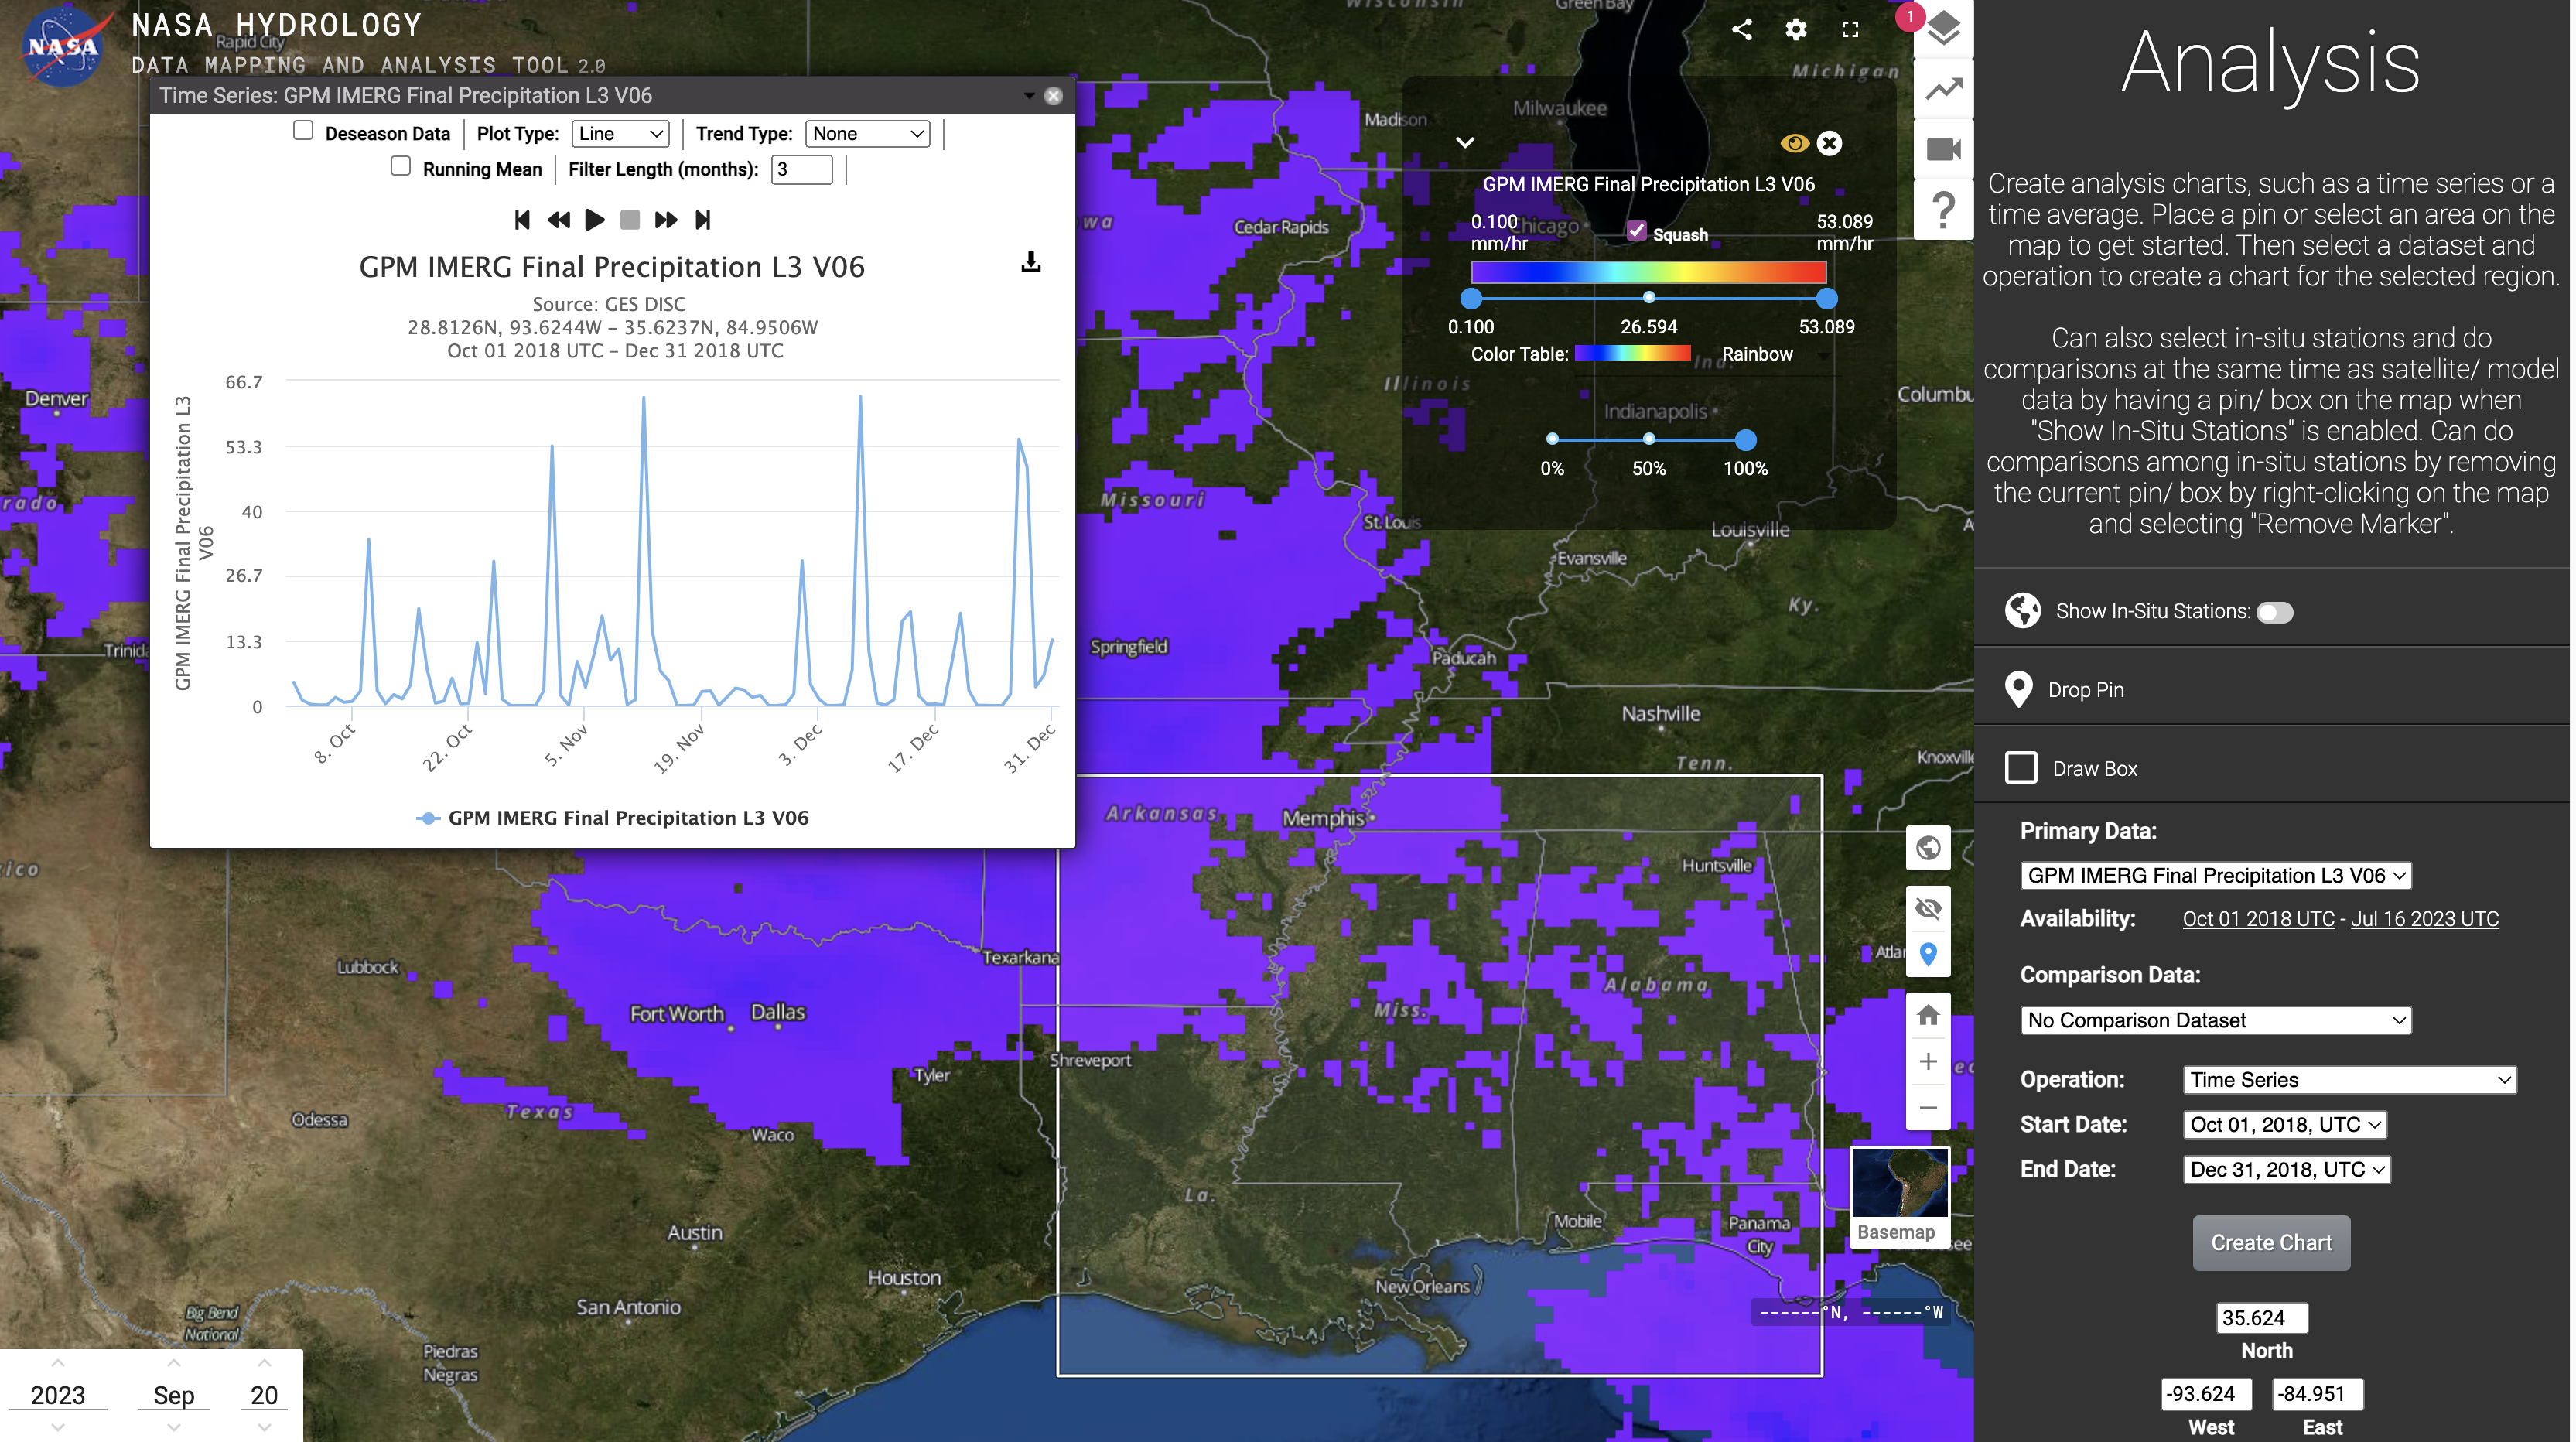
Hydrology Data Mapping and Analysis Tool
The Hydrology Data Mapping Tool is a web-based platform that provides access to NASA-JPL satellite data products related to hydrology and floods. The tool allows users to view and compare datasets, as well as create custom visualizations, animations, and maps for analysis and research. It also provides access to data from satellites and other sources, allowing for comprehensive analysis of hydrology across regions and over time.
Launch Tool

|
|
Featured Use Cases
1. 2019 Mississippi River Flooding
The Mississippi River Basin experienced historic, record breaking, and above normal precipitation during the winter, spring, and summer months. Compounded by river ice and snow melt with warming temperatures, the basin acheived the second highest state recorded river height.
Mississippi Precipitation Rate
March 31, 2019 - May 31, 2019

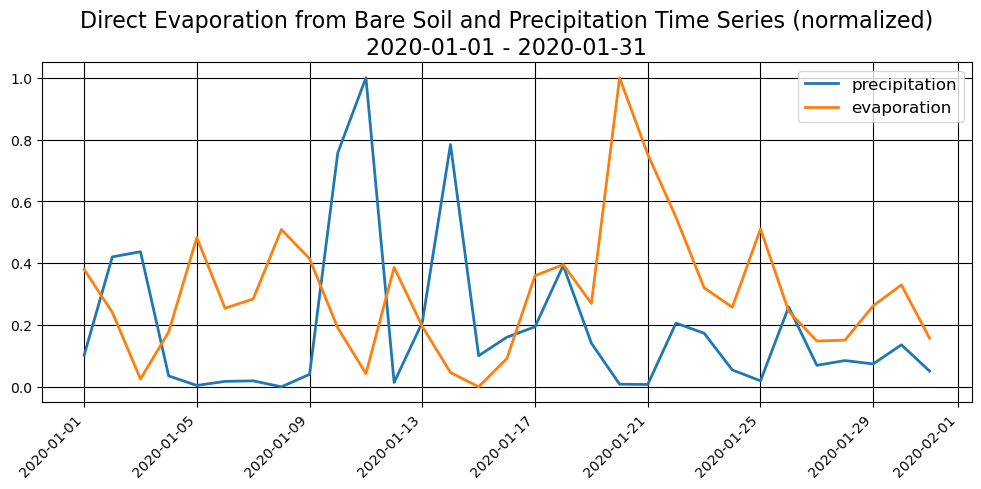
Mississippi Surface Runoff Time Series
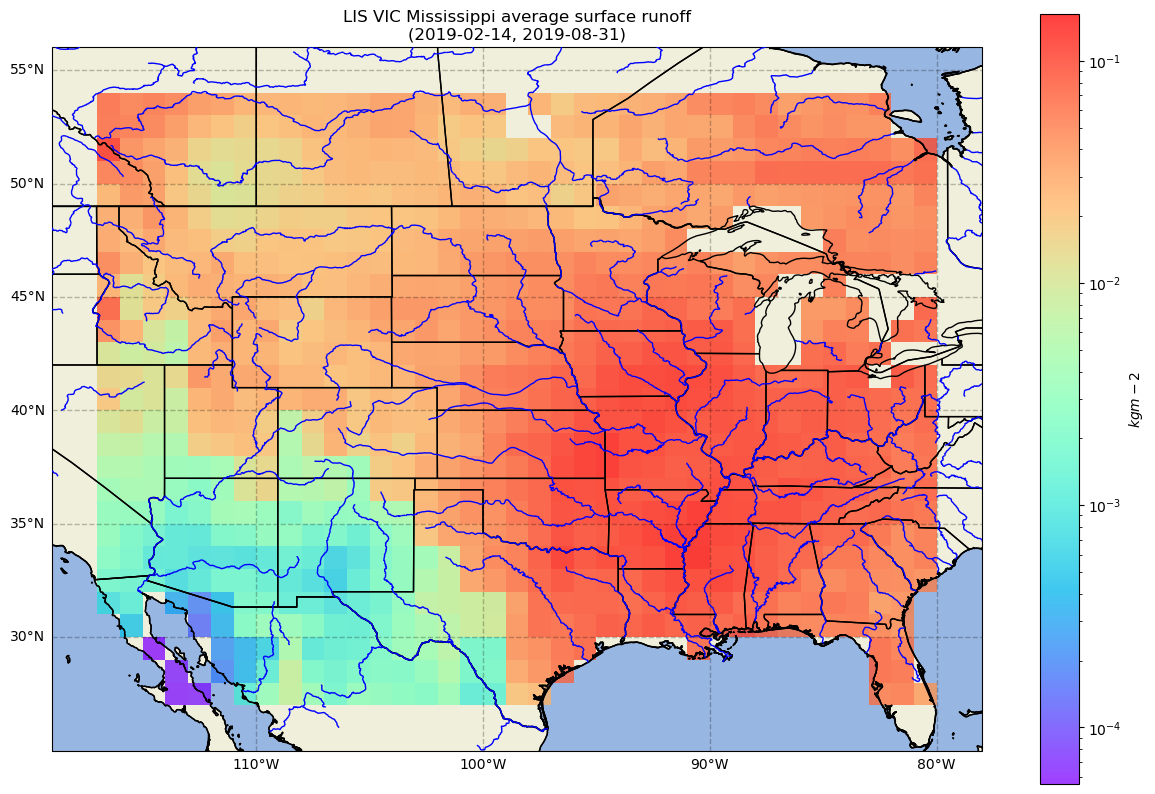
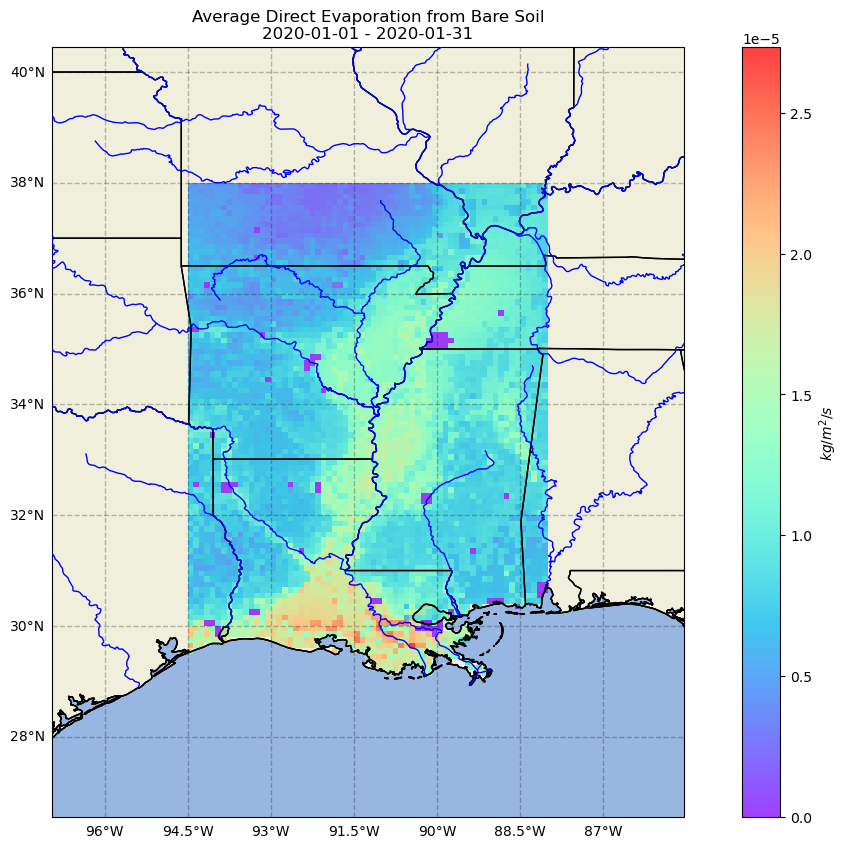
Mississippi Average Surface Runoff

Mississippi Subsurface Runoff Time Series
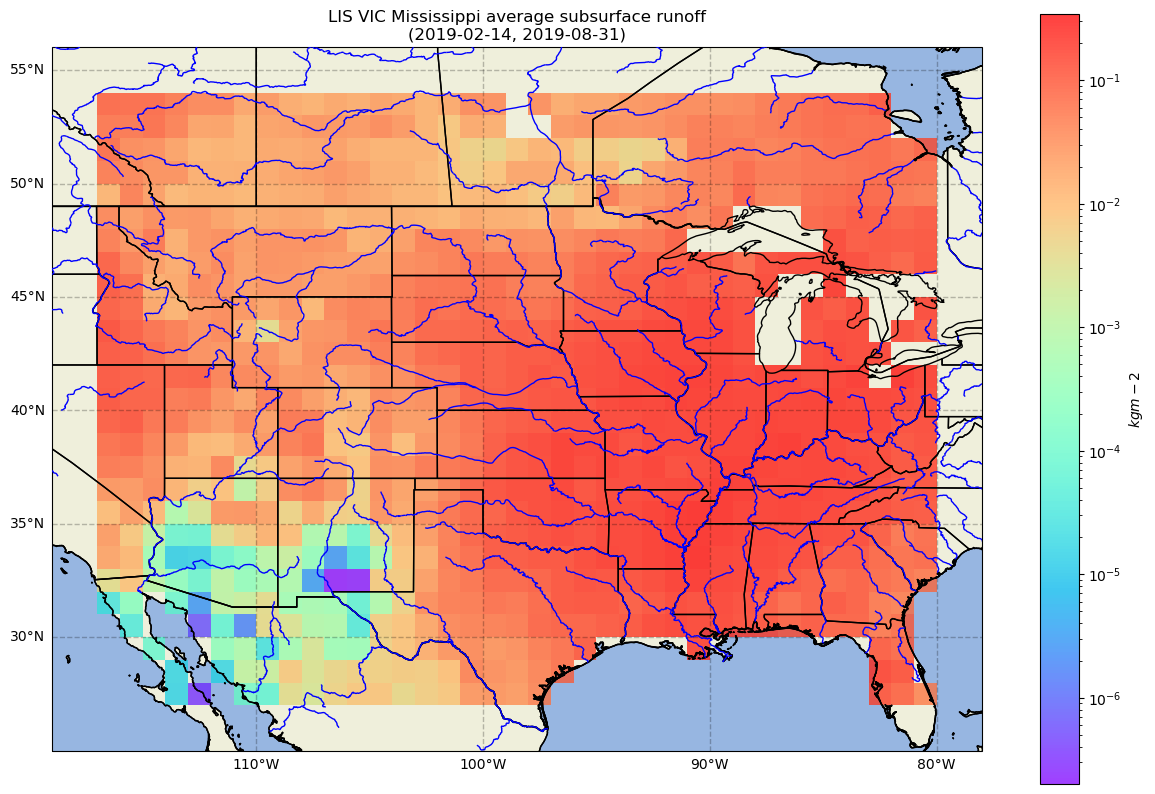
Mississippi Average Subsurface Runoff

Mississippi USGS Streamflow and RAPID Discharge
2. Flooding in the Garonne River, January to March 2021
The upstream part of the river primarily depends on snow and snow melt. The lower/downstream part is rain fed as well as its main tributaries. In southern France, waters are starting to recede after the worst flooding in 40 years swelled the Garonne River between Bordeaux and Toulouse. Vineyards and orchards turned into lakes, and rescue boats floated along small-town streets.

Garonne River Precipitation Rate
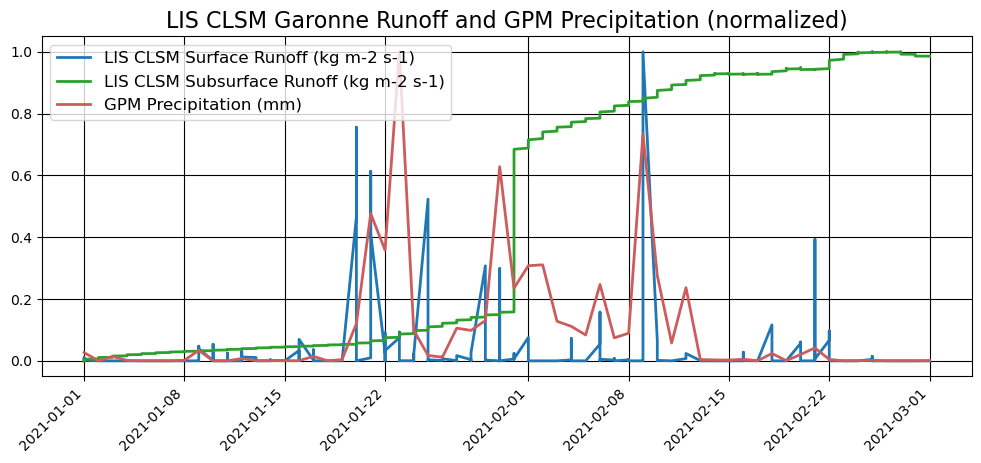
Garonne River Average Surface Runoff Time Series

Garonne River Average Surface Runoff

Garonne River RAPID Discharge